
- All
- Product Name
- Product Keyword
- Product Model
- Product Summary
- Product Description
- Multi Field Search
 English

Views: 0 Author: Site Editor Publish Time: 2026-07-30 Origin: Site


Estimating material handling metrics without precise mathematical frameworks exposes manufacturing facilities to severe operational risks. Production bottlenecks, excessive energy consumption, and premature equipment wear happen when plant managers guess pipe sizes or blower capacities. The core problem is translating facility production demands into exact mechanical or pneumatic conveying specifications. You must account for material behavior, facility layout, and future growth. Relying on vendor rules of thumb often leads to starved extruders or plugged lines. This guide serves as a definitive resource for engineers and plant managers. You will learn to accurately calculate conveying capacity, evaluate system variables, and mitigate implementation risks before procurement. Stop relying on estimates. Use hard math to size your lines, ensure consistent throughput, and build a material handling infrastructure that actually meets your production targets.
A successful material handling network delivers consistent throughput, minimal downtime, energy efficiency, and material integrity. Achieving these criteria requires a rigorous approach to capacity calculation. Miscalculating these parameters leads to severe operational inefficiencies and lost revenue. You need a reliable central feeding system design guide to navigate these engineering challenges.
Under-sizing a system starves downstream processing equipment. This results in lost production hours, compromised product quality, and frequent machine alarms. When an injection molding machine waits for resin, you lose money every second. Conversely, over-sizing leads to excessive capital expenditure and wasted energy. Pushing materials at excessive speeds or using inappropriate air-to-cloth ratios causes severe material degradation. High-velocity impacts generate dust, create angel hair in plastics, and compromise the final product.
To establish a solid baseline, engineers must audit current production rates and forecast future capacity needs. This involves analyzing the maximum consumption rates of all connected machines operating simultaneously. You cannot just look at the daily average. You must look at the peak draw.
Relying solely on average hourly throughput (kg/hr or lb/hr) often causes system failures during surge cycles. Systems must be designed to handle peak instantaneous rates (expressed in kg/s or lb/s) at critical feeder drop points. If a vacuum receiver opens and demands 50 pounds of material in 10 seconds, your system must deliver that instantaneous rate, not just the hourly average. Failing to account for this surge demand results in line blockages and continuous operation interruptions.
Engineers must also evaluate the physical characteristics of the plant. A system designed for a flat, open warehouse will fail in a multi-level facility with numerous vertical lifts. Every elbow, diverter valve, and vertical climb adds resistance. You must calculate the total equivalent length of the piping network to size the blower correctly. We will break down these specific variables in the next section.
Calculating the correct capacity requires a deep understanding of the physical properties of the material and the geometry of the conveying route. These variables dictate the required energy and pipe sizing for the system. You cannot use the same math for virgin plastic pellets and regrind flake.
Bulk density differs significantly from true density. Bulk density accounts for the voids between particles, which is the actual volume the material occupies in the conveying line. Particle size, shape, moisture content, and cohesiveness directly impact flowability. Cohesive or high-moisture materials require adjustments in capacity formulas to prevent bridging and blockages within the piping network.
For example, virgin PET pellets flow easily and have a predictable bulk density. Regrind PET flake, however, has irregular shapes, lower bulk density, and tends to interlock. You need a larger pipe diameter and higher air volume to move the same mass of flake compared to pellets.
| Material Type | Average Bulk Density (lb/ft³) | Flow Characteristics | Conveying Challenge |
|---|---|---|---|
| Virgin PET Pellets | 50 - 55 | Free-flowing | Low friction, easy to convey |
| PP Regrind Flake | 20 - 25 | Interlocking | Prone to bridging and plugging |
| Glass-Filled Nylon | 40 - 45 | Abrasive | High pipe wear, requires hardened elbows |
| TPE / TPU Pellets | 35 - 40 | Sticky / Cohesive | Can smear on pipe walls at high speeds |
The physical layout of the facility heavily influences capacity. Horizontal runs and vertical lifts present different resistance profiles. Friction losses and capacity reductions are caused by pipe bends, elbows, and diverter valves. Engineers use Equivalent Length calculations to translate these directional changes into additional straight-pipe distances. This ensures the blower or motor is adequately sized to overcome the added resistance.
A 90-degree long-radius elbow might add 20 feet of equivalent straight pipe resistance. If your routing includes ten elbows, you just added 200 feet of equivalent resistance to your calculation. Ignoring this will result in an undersized blower and constant line plugs.
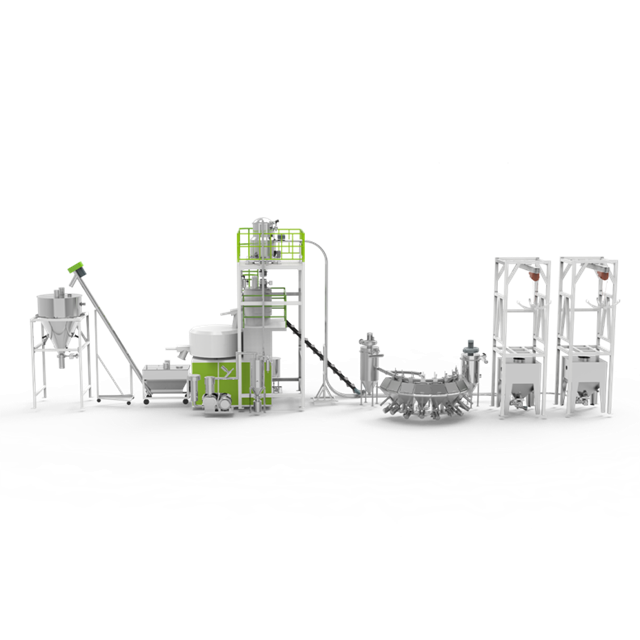
The internal diameter of the conveying line and the velocity required to keep materials suspended are critical factors. In pneumatic systems, this is known as the saltation velocity. If the velocity drops below this threshold, material falls out of the air stream, causing blockages. The cross-sectional area determines the maximum volume of material that can pass through a specific point at a given speed.
You must maintain a velocity high enough to keep the material moving, but low enough to prevent degradation. This is the hardest balance to strike in pneumatic conveying. We typically aim for a pickup velocity around 3,500 to 4,000 feet per minute (FPM) for standard plastic pellets, increasing to 5,000 FPM at the end of the line as the air expands.
Volumetric rate (cubic feet or cubic meters per hour) serves as the primary physical constraint before factoring in material density changes. Understanding the maximum volume the system can handle is essential before converting that volume into mass flow rates based on the specific material being processed. A 3-inch pipe can only hold a specific volume of air and material. You cannot force more mass through it without increasing velocity, which leads to the degradation issues mentioned earlier.
Translating physical variables into actionable engineering specifications requires standard formulas. These calculations provide the foundation for sizing equipment and ensuring reliable material delivery. You must apply these formulas rigorously to build a functional central feeding system.
The foundational continuous flow formula is Q = ρ * A * v, where Q is capacity, ρ is material bulk density, A is cross-sectional area, and v is velocity. This formula calculates the theoretical mass flow rate. Converting volumetric flow (cubic feet or meters per hour) to mass flow (kg/hr or lb/hr) is necessary for accurate production matching, as processing machines consume material by weight, not volume.
Let us look at a practical example. If you have a 4-inch pipe (Area = 0.087 sq ft), conveying material at 4,000 FPM (velocity), and the material bulk density is 40 lb/ft³. The theoretical volumetric flow is Area * Velocity. You then multiply by bulk density to get the mass flow. However, this assumes a 100% full pipe, which never happens in dilute phase pneumatic conveying. You must apply a solids loading ratio (typically 2 to 5 pounds of material per pound of air) to get the actual conveying rate.
Specialized material handling designs often handle discrete units, batch charges, or pocketed rotary valves. For these applications, the discrete pitch formula is used: Capacity (Units/Hour) = (Conveyor Speed × 3600) ÷ Product Pitch. The pitch represents the spacing between discrete material charges or pockets, allowing engineers to calculate exact delivery rates for segmented systems.
When sizing a rotary airlock valve at the bottom of a silo, you calculate the volume of the valve pockets and multiply by the RPM. A 1 cubic foot per revolution (CFR) valve running at 15 RPM moves 15 cubic feet per minute. Multiply that by your 40 lb/ft³ bulk density, and you get 600 lbs/minute theoretical capacity. You then apply an efficiency factor (usually 70-80%) to account for pocket fillage and air leakage.
There is a critical difference between Design Capacity (the exact operating target) and Selection Capacity (the raw equipment rating needed to guarantee performance). Selection Capacity accounts for real-world inefficiencies. The calculation is: SC = Design Capacity × Material Factor × Equipment Design Factor. This ensures engineers account for variables like rotary valve leakage, filter blinding, or mechanical slip, preventing the system from underperforming in actual production environments.
Calculation adjustments are needed depending on the conveying method. Vacuum or pressure pneumatic systems require complex calculations involving air density, pressure drop, and air-to-material ratios. Mechanical systems, such as screw conveyors or drag chains, rely more heavily on volumetric displacement and mechanical efficiency ratings. A screw conveyor capacity depends on the screw diameter, pitch, RPM, and trough loading percentage (usually 30% to 45% full to prevent bearing damage).
Theoretical calculations must be balanced with practical implementation realities. Engineering a reliable system involves managing trade-offs between speed, capacity, and material integrity. You cannot just crank up the blower speed and expect good results.
Calculating capacity directly dictates the required air volume (CFM) and operating pressure (PSI/inHg). These metrics are crucial for blower selection. Underestimating pressure drop due to complex routing or high material density will result in an undersized blower, leading to frequent line plugs and system downtime.
Every component adds pressure drop. The pickup wand, the straight pipe, the elbows, the flexible hose connections, and the final filter receiver all resist airflow. You must sum these resistance values. A typical vacuum system operates between 10 to 14 inches of mercury (inHg). If your calculated pressure drop is 16 inHg, a standard positive displacement blower will stall, and the line will plug. You must either increase the pipe diameter to lower the velocity and friction, or switch to a high-vacuum pump.
Engineers face a constant compromise between increasing speed to boost capacity and lowering speed to prevent material damage. Fragile materials can break, generate dust, or create "angel hair" in plastics if conveyed too quickly. Finding the optimal velocity that meets capacity requirements while preserving material integrity is a critical design phase.
Angel hair occurs when plastic pellets slide against the inside of a pipe elbow at high speeds. The friction melts the surface of the pellet, leaving a thin smear of plastic on the pipe wall. Subsequent pellets peel this smear off, creating long, stringy angel hair that eventually clogs filters and rotary valves. To prevent this, you must calculate the terminal velocity of the specific pellet and ensure your conveying velocity stays just above the saltation point, but well below the melting friction point. Using specialized shot-peened elbows also helps reduce this friction.
A well-designed centralized feeding system accommodates future production line additions without requiring a complete system overhaul. This involves sizing main header lines and blowers with a specific percentage of excess capacity, allowing for easy integration of new processing machines as the facility expands.
If you plan to add three more injection molding machines next year, size your main vacuum header for that future capacity now. It is much cheaper to install a 4-inch header today and run it at a lower capacity than to rip out a 3-inch header next year. Install variable frequency drives (VFDs) on your blowers so you can dial back the airflow for current needs and ramp it up when you add the new machines.
Collaborating with an experienced central feeding system manufacturer is essential for translating theoretical calculations into a functional reality. Their expertise bridges the gap between math and practical application. Do not try to engineer a complex pneumatic network alone if you lack the specific fluid dynamics experience.
When evaluating vendor proposals, scrutinize their capacity claims. Look for transparent calculations rather than guaranteed estimates. A reputable manufacturer will clearly explain how they arrived at their sizing recommendations, detailing the specific material factors and equivalent length calculations used. Ask to see the math. If they just give you a quote with a blower size and no pressure drop calculations, walk away.
Theoretical math must be backed by physical testing at the manufacturer's facility. Using the exact production material and proposed pipe routing validates the calculations and identifies potential flow issues before installation. Send them a gaylord of your worst-flowing regrind. Make them convey it through a test loop that mimics your facility's vertical lifts and elbow count. Measure the degradation. Check the filter for dust.
Watch for red flags during the procurement phase. Ignoring bulk density variations between virgin and regrind materials is a major warning sign. Failing to account for high-altitude air density changes will ruin a system installed in Denver compared to one in Miami. Undersizing filtration areas to save money on the receiver will result in constant filter blinding and loss of suction.
Calculating conveying capacity requires a blend of theoretical physics and practical material handling experience. Accurate sizing prevents costly downtime, protects material integrity, and ensures efficient energy use. When selecting a system design, prioritize mathematical transparency, scalability, and proven vendor testing capabilities. Stop guessing and start calculating.
A: For continuous flow, the standard formula is Q = ρ * A * v, where Q is capacity, ρ is material bulk density, A is cross-sectional area, and v is velocity. For discrete feeding, use Capacity (Units/Hour) = (Conveyor Speed × 3600) ÷ Product Pitch.
A: Design Capacity is the actual volume needed by the plant. Selection Capacity is a de-rated calculation used by a manufacturer to size equipment so it operates reliably under real-world inefficiencies, such as filter blinding, rotary valve leakage, or mechanical slip.
A: Higher bulk density requires more energy and specific line sizing to move the same volume. It directly impacts blower and motor specifications, as denser materials demand greater force and higher pressure differentials to remain suspended or be mechanically pushed through the piping network.
A: The terms are used interchangeably in industrial manufacturing. Both describe a singular, automated material distribution network designed to feed multiple processing machines from a central storage location using shared blowers and piping headers.
A: Changes in direction increase friction and pressure drop within the conveying line. This reduces overall system efficiency and requires capacity de-rating, calculated using Equivalent Length metrics to ensure blowers are adequately sized to overcome the added resistance.
A: Manufacturers possess proprietary sizing software, empirical test data, and real-world implementation experience. They can account for variables like air density changes and material degradation that standard formulas often miss, ensuring the final system performs reliably.


