
- All
- Product Name
- Product Keyword
- Product Model
- Product Summary
- Product Description
- Multi Field Search
 English

Views: 0 Author: Site Editor Publish Time: 2026-07-20 Origin: Site


Investing in a plastic recycling facility carries massive capital expenditure risks when operators miscalculate equipment sizing. Unlike traditional manufacturing where raw materials arrive uniform and predictable, plastic recycling relies on highly variable waste streams. The physical and chemical realities of incoming bales dictate the true operational throughput of the plant. A common failure point happens when plant managers base equipment procurement solely on a target output tonnage. They ignore specific contamination levels, moisture content, and polymer ratios of their feedstock. This oversight leads to immediate bottlenecks, excessive wear on shredder blades, and failure to meet off-take agreements. Precise, audited feedstock data forms the only reliable foundation for accurate plastic recycling line capacity planning. Understanding your exact input material allows for accurate equipment specification, realistic yield forecasting, and effective vendor evaluation.
Generic production capacity models fail in the recycling sector because they assume a consistent input. Shifting from an assumed throughput to a data-validated throughput is necessary. You must understand exactly what enters the facility to predict what will exit. When you assume a standard bale of PET bottles will yield 90% usable flake, you set yourself up for failure if that specific regional bale actually contains 25% moisture and heavy sand contamination. The entire line will choke trying to process the unexpected waste volume.
Demand-driven capacity alignment involves reverse-engineering calculations. Start with downstream off-take contract requirements, such as final pellet purity, melt flow index (MFI), and volume. Work backward from these targets to define the minimum input feedstock standards required to achieve them. If your buyer demands 2,000 kg/hr of high-purity rPET, and your feedstock audit shows a 30% yield loss due to labels, caps, and dirt, your front-end shredding and sorting capacity must handle at least 2,850 kg/hr just to meet the baseline.
Successful capacity planning means maintaining continuous, bottleneck-free operation at target output volumes, regardless of expected feedstock fluctuations. The cost of data blindness is severe. Poor data leads to excessive wear and tear, frequent maintenance downtime, and an inability to meet contracted output volumes. Operators who guess their input metrics end up replacing friction washer screens monthly instead of quarterly, destroying their operational margins.
| Planning Approach | Input Assumption | Equipment Sizing Result | Operational Outcome |
|---|---|---|---|
| Static (Traditional) | Uniform, clean material | Undersized sorting and washing | Frequent bottlenecks, high wear |
| Data-Driven (Dynamic) | Variable, audited feedstock | Oversized front-end, modular buffers | Continuous throughput, predictable yield |
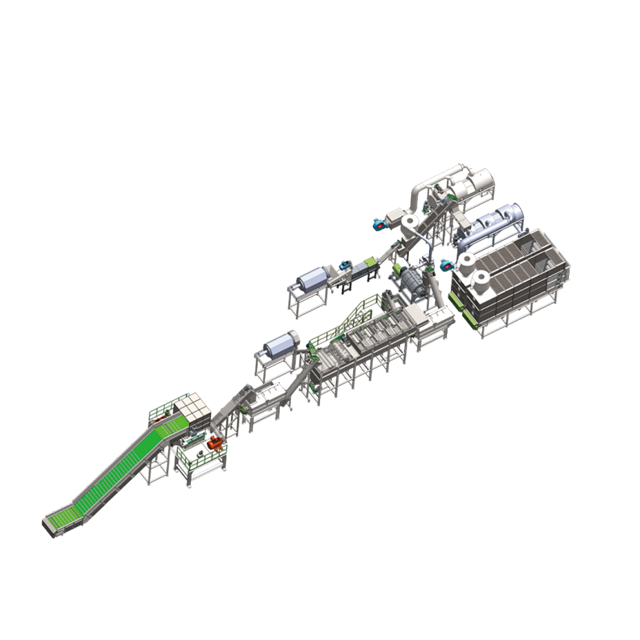
Auditing the exact mix of polymers in your feedstock is critical. A bale of post-consumer waste might contain PET, HDPE, LDPE, and PP. Knowing these ratios helps determine the necessary sorting technology. You cannot simply throw a mixed bale into a standard shredder and expect clean separation downstream. The specific gravity and melt points of these polymers require distinct processing paths.
The percentage of non-target plastics directly impacts the required capacity of optical sorters and manual sorting stations. If a stream contains 15% non-target material, the sorting infrastructure must be sized to handle and eject that volume efficiently without slowing down the main line. If your optical sorter is only rated for a 5% ejection rate, a 15% contamination spike will overwhelm the air jets, sending bad plastic into your final product.
Contaminants fall into several categories, each requiring a specific mechanical response. Abrasive contaminants like sand and glass cause rapid wear on cutting blades and friction washers. Organic contaminants like food residue and paper require specific washing parameters. Chemical contaminants like adhesives and oils demand targeted chemical treatments or hot washing stages.
The volume and type of contamination determine the required residence time and mechanical agitation needed in the system. Heavy organic loads require longer washing times, which means larger tanks or slower throughput rates to achieve the desired cleanliness. If you have high sand content, you need heavy-duty pre-wash trommels to remove the grit before it reaches your granulator blades.
Processing requirements vary drastically between baled bottles, loose agricultural film, and rigid regrind. Baled bottles require aggressive de-baling and initial shredding, while loose film requires specialized handling to prevent tangling around rotating shafts. You cannot feed low-density film into a hopper designed for heavy rigid plastics; it will simply float and bridge, starving the extruder.
Bulk density dictates the sizing of infeed conveyors, shredder hoppers, and material handling silos. Low-density materials like film require larger hoppers and wider conveyors to prevent bridging or starvation of the downstream equipment. A 1,000 kg/hr line processing rigid HDPE requires a much smaller physical footprint than a 1,000 kg/hr line processing LDPE agricultural film.
The water weight in incoming feedstock skews input tonnage metrics. If you purchase 1,000 kg of material with 15% moisture, you are only buying 850 kg of actual plastic. This discrepancy must be accounted for in yield calculations, otherwise your purchasing department will constantly wonder why the plant is underproducing.
Initial moisture impacts the energy requirements and sizing of thermal and mechanical drying stages. Wetter feedstock requires more robust centrifuges or longer thermal drying tunnels to reach the low moisture levels required before extrusion. Pushing wet flake into an extruder causes severe foaming and degrades the final pellet quality.
Regional collection infrastructure limitations alter contaminant profiles and raw material quality. Material sourced from areas with single-stream recycling will have higher contamination rates than material from dual-stream or deposit systems. You must audit the specific MRF (Materials Recovery Facility) providing your bales.
Seasonal impacts also shift required design margins. Post-consumer waste often carries higher moisture and organic loads during wet seasons. Capacity calculations must include a design margin to handle these seasonal peaks without bottlenecking the line. A plant designed for dry summer bales will fail during the winter rainy season if the dryers are not oversized.
Calculating expected mass loss is fundamental. If your feedstock has 20% contamination and 5% moisture, a 2,000 kg/hr input will yield significantly less usable output. The actual plastic yield might only be 1,500 kg/hr. You must build this mathematical reality into your plant design from day one.
To account for this mass loss, upstream equipment like shredders and sorters must be sized larger than downstream equipment. The front end of the line processes the gross weight, while the back end processes the net weight. A properly designed line looks like a funnel, with massive capacity at the intake that tapers down to a highly efficient, continuous flow at the extruder.
Theoretical calculations on spreadsheets must be validated with physical testing of representative feedstock samples. Paper calculations cannot account for the unique behavior of mixed waste streams. A spreadsheet might say a friction washer can handle 2 tons per hour, but if your specific material is covered in heavy industrial glue, that washer might only handle 1 ton per hour effectively.
Utilize pilot-scale runs to establish true operational benchmarks. These tests reveal baseline wear rates, realistic cycle times, and the actual effectiveness of proposed sorting and washing technologies. Running a 10-ton pilot batch will expose material handling issues that a 10-kg lab test will completely miss.
Planning for worst-case scenario feedstock batches is necessary. Designing a system only for average quality means the line will fail when a particularly dirty or wet batch arrives. If your average contamination is 10%, but you occasionally receive bales with 25% contamination, your sorting equipment must be capable of handling that 25% peak.
Evaluate the trade-offs of building surge hoppers and buffer silos versus over-sizing the core processing machinery. Buffers help smooth out flow variations, allowing the core machinery to run at a steady, optimized rate. Installing a large buffer silo between the washing and extrusion phases ensures the extruder never runs dry, even if the shredder goes down for a 15-minute blade change.
Contamination data directly connects to the specification of a plastic washing line. High levels of abrasive dirt require specific wear-resistant metallurgy and larger friction washers to handle the aggressive wear. Standard stainless steel screens will disintegrate in weeks if processing heavy agricultural film loaded with silica sand; you need hardened, wear-resistant alloys.
The ratio of sinking to floating polymers dictates the dimensions and separation capacity of sink-float tanks. If the feedstock contains a high percentage of heavy plastics, the extraction augers at the bottom of the tank must be sized accordingly. A tank designed to skim floating PE will fail if it suddenly receives a massive influx of sinking PET that overloads the bottom discharge auger.
Feedstock melt flow index (MFI) variations and residual moisture dictate extruder sizing and degassing requirements in the plastic pelletizing system. High moisture levels require multiple degassing zones to prevent voids in the final pellets. If your washing line leaves 2% moisture on the flake, a standard single-vent extruder will produce weak, foamy pellets.
Residual microscopic impurities remaining after washing dictate the required surface area and screen-changing frequency of the melt filtration unit. Dirtier material requires larger filters or continuous screen changers to maintain throughput. If you undersize the melt filter, your operators will spend half their shift changing screens, destroying your production capacity.
A trustworthy plastic washing line manufacturer will require a detailed feedstock profile before issuing a binding quote. They often request physical samples to conduct their own analysis. If a vendor hands you a quote based on a five-minute phone call, walk away. They are selling you a generic machine, not an engineered solution.
Watch for red flags. Vendors who offer guaranteed throughputs based solely on generic input descriptions, without asking for contamination percentages or pilot-run validations, are likely overpromising. They will blame your material when the machine fails to hit the promised numbers on the factory floor.
Top-tier manufacturers run physical trial runs of the buyer's material. They collect live sensor and OEE data during these trials to prove system throughput and efficiency before finalizing the purchase agreement. You should demand to see your actual dirty bales processed through their test facility, yielding clean flake that meets your exact specifications.
Buying standardized equipment offers lower initial capital expenditure but carries higher operational risk if the feedstock varies. Data-driven, bespoke line engineering ensures the system matches the specific waste stream. An off-the-shelf shredder might work for clean factory scrap, but post-consumer waste requires custom rotor designs and specific screen sizes.
Manufacturers use feedstock data to customize motor sizing, blade configurations, and water filtration loops. This customization ensures optimal performance and longevity for the specific materials being processed. Upgrading a motor from 75kW to 90kW based on bulk density data can prevent constant jamming and electrical faults.
Municipal and commercial waste streams change over time due to consumer habits, packaging redesigns, and policy changes. A system designed for today's waste might struggle with tomorrow's. As brands lightweight their packaging, the bulk density of your incoming bales will drop, requiring modifications to your infeed systems.
Traditional Enterprise Resource Planning (ERP) and Manufacturing Execution Systems (MES) fail to model the variable capacity of recycling lines because they assume fixed yields. Structure custom data collection pipelines to feed real-time yield and contamination losses back into inventory forecasting systems. You need sensors on the reject chutes to measure exactly how much mass is being lost in real-time.
Build footprint allowances into the initial plant layout. Leaving space to add extra friction washers or optical sorters later allows the facility to adapt to dirtier or more complex waste streams. Do not pack the machinery so tightly that you cannot fit a forklift between the tanks for maintenance.
Utilize variable frequency drives (VFDs) and modular PLC programming. These technologies allow operators to adjust processing speeds and parameters to adapt to changing feedstock densities and throughput requirements. A VFD on the shredder allows you to slow down the rotor when processing heavy purges, preventing motor burnout.
A: Contamination level is the most critical variable. It dictates the required washing intensity, sorting capacity, and expected yield loss, directly impacting the sizing of almost every component in the line. High contamination requires oversized front-end equipment to maintain downstream throughput.
A: High contamination requires longer residence times in washing equipment and more aggressive friction washing. This slows down the overall throughput and requires larger equipment, such as extended sink-float tanks and heavy-duty trommels, to maintain target output volumes without compromising flake purity.
A: Bulk density determines the physical volume of material moving through the system. Low-density materials like agricultural film require larger hoppers, wider conveyors, and specialized feeding mechanisms to prevent blockages, bridging, and starvation of the downstream extrusion equipment.
A: Subtract the percentage of moisture, non-target plastics, and all organic and inorganic contaminants from the total input weight. The remaining percentage represents the theoretical maximum yield of usable plastic. Always validate this calculation with physical pilot testing.
A: They need detailed information on polymer types, bulk density, moisture content, and specific percentages of organic, inorganic, and chemical contaminants. Top manufacturers will require physical samples of your bales to run through their test facilities before guaranteeing any throughput numbers.


